- Recent instability and revolutionary change in the North African region has highlighted the potential for large flows of migrants into Europe.
- The five Arab countries of North Africa have rapidly growing populations. Egypt, at 84 million, already has a larger population than Germany.
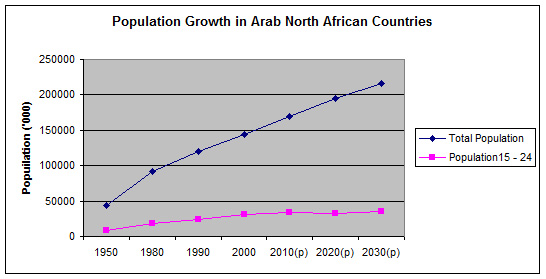
- Their population grew from 45 million in 1950 to 170 million today - an increase of 125 million, or 2 million people a year on average.
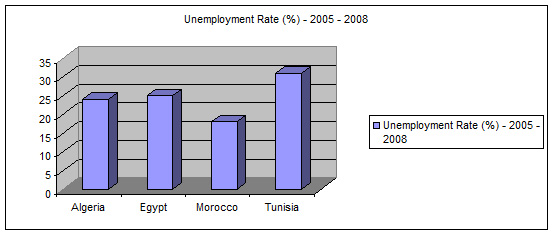
- Youth unemployment is very high with three million 15- 24 year olds unemployed (excluding Libya where no figures are available).
- Before the revolutions in Egypt and Tunisia, all these countries were governed by regimes which were regarded as being repressive, authoritarian and corrupt.
1 The Arab countries of North Africa have been the source of substantial migration, both illegal and legal, into Europe. Some countries in the region - notably Libya and Morocco – have also been used for transit by migrants originating in the countries south of the Sahara to immigrate clandestinely into Europe. Estimates of the Sub-Saharan population of Libya, mostly illegal, range up to 2 million. So far, the numbers coming to Britain have been limited (Annex A).
2 Since January this year three countries in North Africa - Egypt, Libya and Tunisia - have experienced acute political unrest and change. Some of the factors behind these developments are unique to each of these countries, but they also share some social and political characteristics with other countries in the region:
- All have very high rates of unemployment among those aged 15 - 24.
- These young people constituted about one fifth of the populations. Their number has been growing very rapidly over recent decades but is expected to decline somewhat over the next twenty years in Algeria Tunisia and Morocco.
- All of these countries to varying degrees have (or had) governments which were authoritarian, politically repressive, and often corrupt.
3 Demographic pressures, illustrated in the graph below have been a key factor in driving political and social unrest:
Figure 1
4 Below are summarised some of the consequences of this rapid population increase over the sixty years from 1950 (see also the tables in Annex B).
1950 - 2010
- Between 1950 and 2010 populations of these five countries grew almost fourfold, from 44 million to almost 170 million in 2010 - an increase of over 125 million which is over 2 million a year.
- In 1950, the total population of these countries was lower than that of the UK; by 2010, their combined population was almost three times that of the UK
- In 1950, the combined population of these countries, at 44 million was one-third that of those European countries (France, Greece, Italy and Spain) facing them across the Mediterranean. By 2010 their population was 169 million - a gap of only 10 million.
- The biggest increase was in Egypt, where population grew by over 60 million.
- Over the same period, the total number of people aged 15 to 24 in all these countries increased by over 25 million to 34 million - averaging over half a million every year
- Excluding Libya, for which there are no data, numbers of young unemployed in 2005 in the remaining four countries totalled over 3 million.
- The projected population growth in these countries over the next 20 year period is 46 million, or almost 2.5 million a year, to a total of 215 million.
5 Arab countries in the Middle East are reported by the ILO as having the highest rates of unemployment in the world. Unemployment rates for young people - aged 15 to 24 - are tabulated below for four of these countries:
| Country | Unemployment Rate (%) for Young people (15 – 24) |
| Algeria 2008 | 24 |
| Egypt 2007 | 25 |
| Libya | N/A |
| Morocco 2008 | 18 |
| Tunisia 2005 | 31 |
Political instability
6 The countries of this region have had governments that are authoritarian, undemocratic and corrupt. Below are results for these countries in two indices that measure democracy and corruption and facilitate comparison between countries (the index dates from 2010 and therefore does not reflect the recent revolutions in Egypt and Tunisia):
Democracy Index
| Country | Regime Type | World Ranking (out of 167) |
| Algeria | Authoritarian | 125 |
| Egypt | Authoritarian | 138 |
| Libya | Authoritarian | 158 |
| Morocco | Authoritarian | 116 |
| Tunisia | Authoritarian | 146 |
7 Three out of five of these countries are in the bottom quintile of rankings, and the two others are not far removed from it.
Corruption Index
| Country | World Ranking (out of 178) |
| Algeria | 105 |
| Egypt | 98 |
| Libya | 146 |
| Morocco | 85 |
| Tunisia | 59 |
8 Whilst comparisons with other countries using this index are more encouraging, only two countries - Morocco and Tunisia - are not in the bottom half of rankings.
31 March, 2011
Annex A
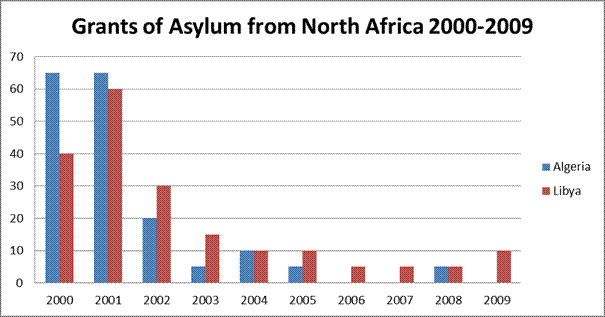
Figure 1 Grants of Asylum from Algeria and Libya between 2000 and 2009. Source: Control of Immigration Statistics 2009.
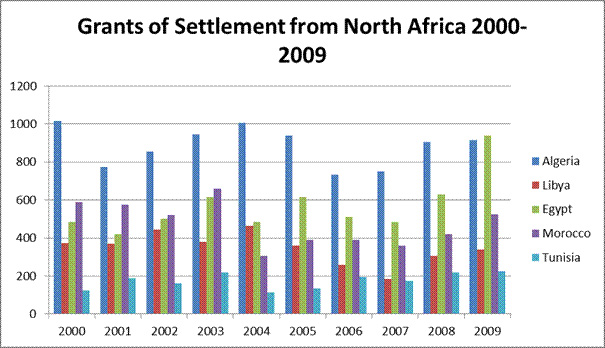
Figure 2 Grants of settlement from North Africa between 2000 and 2009. Source: Control of Immigration Statistics 2009.
Annex B
Table 1: Total Population
| Country | 1950 | 1980 | 1990 | 2000 | 2010 | 2020 | 2030 |
| Algeria | 8753 | 18811 | 25283 | 30506 | 35423 | 40630 | 44726 |
| Egypt | 21514 | 44433 | 57785 | 70174 | 84474 | 98638 | 110907 |
| Libya | 1029 | 3063 | 4365 | 5346 | 6546 | 7699 | 8519 |
| Morocco | 8953 | 19567 | 24805 | 28827 | 32381 | 36200 | 39259 |
| Tunisia | 3530 | 6457 | 8215 | 9452 | 10374 | 11366 | 12127 |
| TOTAL | 43779 | 92331 | 120453 | 144305 | 169198 | 194533 | 215538 |
| Country | 1950 | 1980 | 1990 | 2000 | 2010 | 2020 | 2030 |
| Algeria | 18.6 | 19.3 | 20.4 | 22.6 | 20.5 | 14.8 | 15.5 |
| Egypt | 19 | 19.7 | 18.4 | 20.9 | 20.2 | 17.4 | 17.2 |
| Libya | 18.5 | 18.2 | 21.1 | 24.3 | 17.3 | 16.3 | 17 |
| Morocco | 19.2 | 20.7 | 20.2 | 21.1 | 19.7 | 16 | 15.6 |
| Tunisia | 18.2 | 21.1 | 20 | 20.7 | 19.3 | 13.7 | 13.3 |
| Country | 1950 | 1980 | 1990 | 2000 | 2010 | 2020 | 2030 |
| Algeria | 1628 | 3631 | 5158 | 6894 | 7262 | 6013 | 6933 |
| Egypt | 4088 | 8753 | 10632 | 14666 | 17064 | 17163 | 19076 |
| Libya | 190 | 557 | 921 | 1299 | 1132 | 1255 | 1448 |
| Morocco | 1719 | 4050 | 5011 | 6082 | 6379 | 5792 | 6124 |
| Tunisia | 642 | 1362 | 1643 | 1957 | 2002 | 1557 | 1613 |
| TOTAL | 8268 | 18354 | 23365 | 30899 | 33839 | 31780 | 35194 |
Note: Data for 2010 – 2030 is projected using ‘medium variant’assumption.
Table 4: Numbers of Young - 15 to 24 - Unemployed (‘000)
| Country | 2001 | 2002 | 2003 | 2004 | 2005 | 2006 | 2007 | 2008 |
| Algeria | 1081.4 | N/A | 996 | 762.3 | 699.1 | 536.4 | 596.6 | 528 |
| Egypt | 1385.7 | 1152.7 | 1476.9 | 1521.1 | 1762.5 | 1632.6 | 1342.7 | |
| Morocco | 498.7 | 461.7 | 466 | 425.4 | 420.9 | 414.9 | 428.6 | 449.4 |
| Tunisia | 202.8 | 208.3 | 206.2 | 193.6 | 205.9 | N/A | N/A | N/A |
| TOTAL | 3168.6 | N/A | 3145.1 | 2902.4 | 3088.4 | N/A | N/A | N/A |
Note: There are no data for Libya
No comments:
Post a Comment